
What is CERAC?
Uncertainty surrounding the costs and effects in cost-effectiveness analysis is typically described using the cost-effectiveness acceptability curve (CEAC), which plots probability of an intervention to be cost-effective at a wide range of threshold ratios. However, the CEAC does not provide information about the “magnitude of ‘bad’ outcomes” and therefore may not be appropriate to inform decision makers who are risk averse (who need to meet budgetary constraints and health outcome targets).
A paper published in October 2020 by Sendi in PharmacoEconomics “introduces the cost-effectiveness risk-aversion curve that penalizes the expected net benefit of a program for its downside deviation for a wide range of threshold cost-effectiveness ratios, and may provide an alternative helpful tool to inform risk-averse decision makers”.
Cost-effectiveness risk-aversion curve (CERAC) plots the net benefit-to-risk ratio for each individual intervention for all possible threshold willingness-to-pay ratios (in $/QALY).
Example of CERAC
Authors illustrated CERAC using a comparison between Program D and Program C.
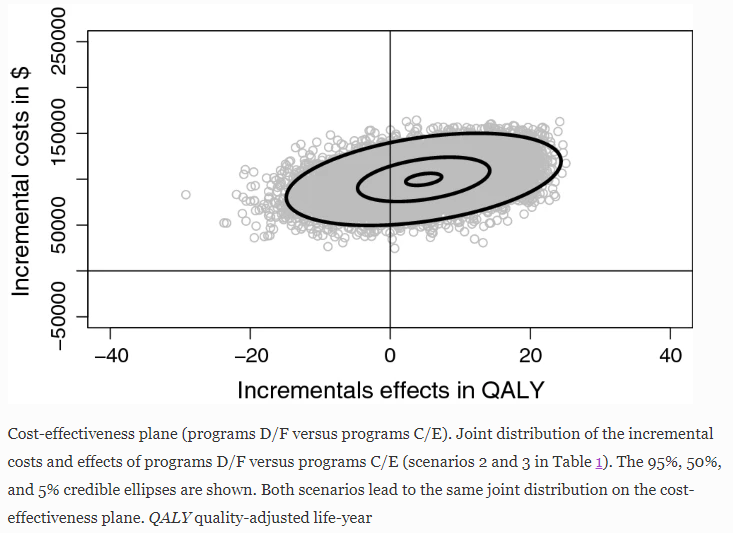
Step 1.Consider the scenario where “the mean incremental cost is $100,000 and the mean incremental effect is 5 QALYs, with the mean ICER being $20,000/QALY gained. Hence, at a threshold ratio greater than $20,000/QALY, a risk-neutral decision maker would prefer program D over program C.”
Step 2. The joint distribution of incremental costs and effects, has been estimated by sampling 10,000 times from the distributions for costs and effects.
Step 3. Authors truncated the normal distribution at zero to exclude negative values for costs and effects which yielded the corresponding CEAC. The CEAC “shows that at a threshold ratio greater than $20,000/QALY, program D becomes the preferred strategy, with a higher probability of being cost effective. However, by summarizing the joint distribution of incremental costs and effects using the CEAC, we cannot tell which program has the greatest downside variation with respect to costs and effects.”

Step 4. Based on mean incremental cost, mean incremental effects and ICER (as given in step 1), “it is obvious that program D has a much greater variation for both costs and effects than program C.” The CERAC therefore favors program C over program D for all threshold ratios , although program D has a higher expected NMB for threshold ratios greater than $20,000/QALY.

